Anytime you open the Chrome or Firefox dev tools to debug JavaScript code, you should disable JavaScript source maps. This is the first thing I do when I open developer tools on a new machine.
Why You Should Disable Them
This comment on Hacker News explains the problem:
I can never get watched variables to work. The scoping and updating rules for it are a mystery to me. I assume only global variables can be watched, but even then it never works as I expect, so I end up just flooding the log with values when testing. -russellbeattie
JavaScript source maps are good at exactly on thing: passively reading minified/compiled JavaScript source code / call stacks. Counterintuitively, if you are in any way interacting with source code in the debugger, you will have a much better experience disabling JavaScript source maps.
Examples
To demonstrate the problem, let’s view the same source code in the debugger, both with and without source maps, and see what works and what doesn’t.
Source Maps OFF
With source maps off, we are able to hover an expression and see it’s value. Note that we can add the expression to the “Watch expressions” pane and the value is correctly rendered:
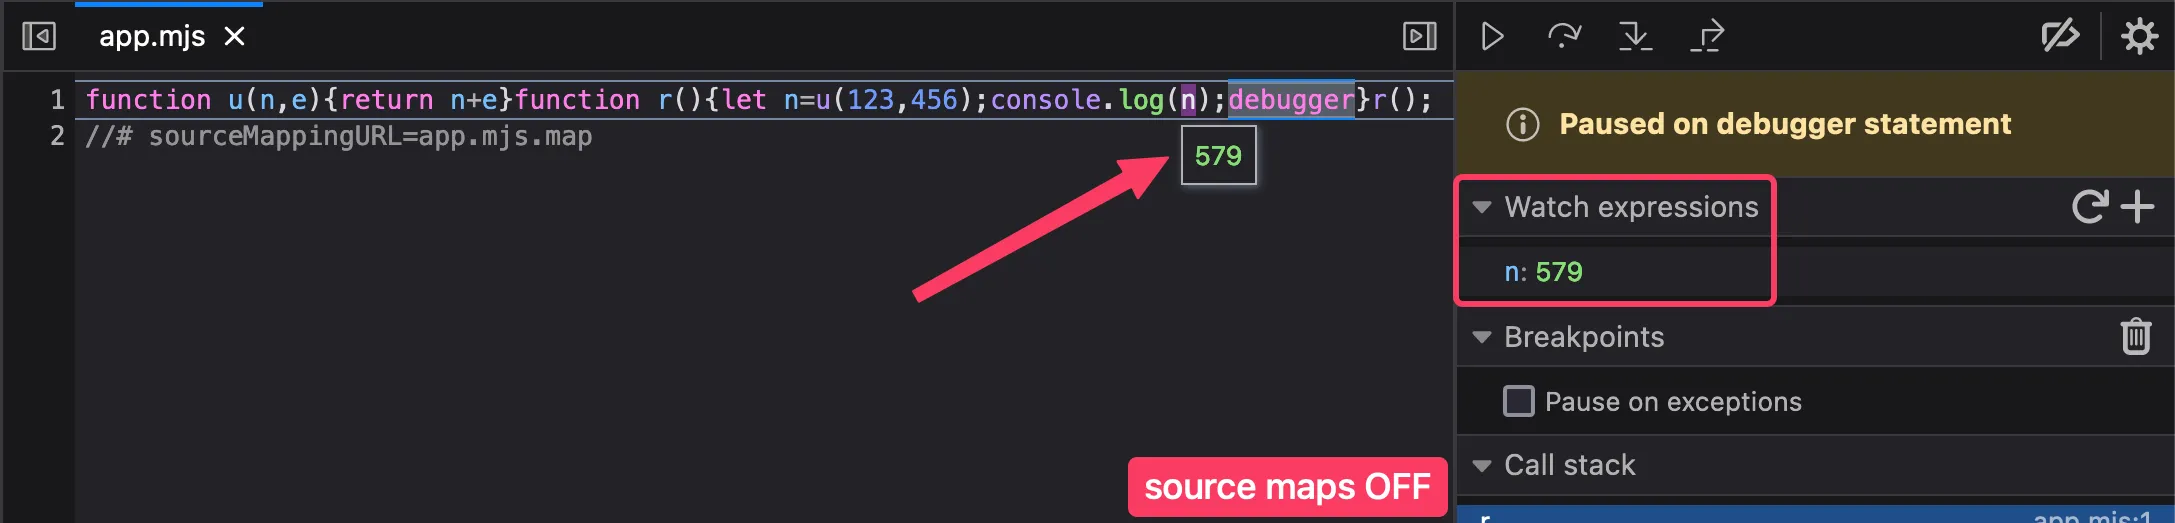 ✅ Tooltips work ✅ Watch expressions work
With source maps off, we are able to use the expression
n (as seen in the source) in the JS console:
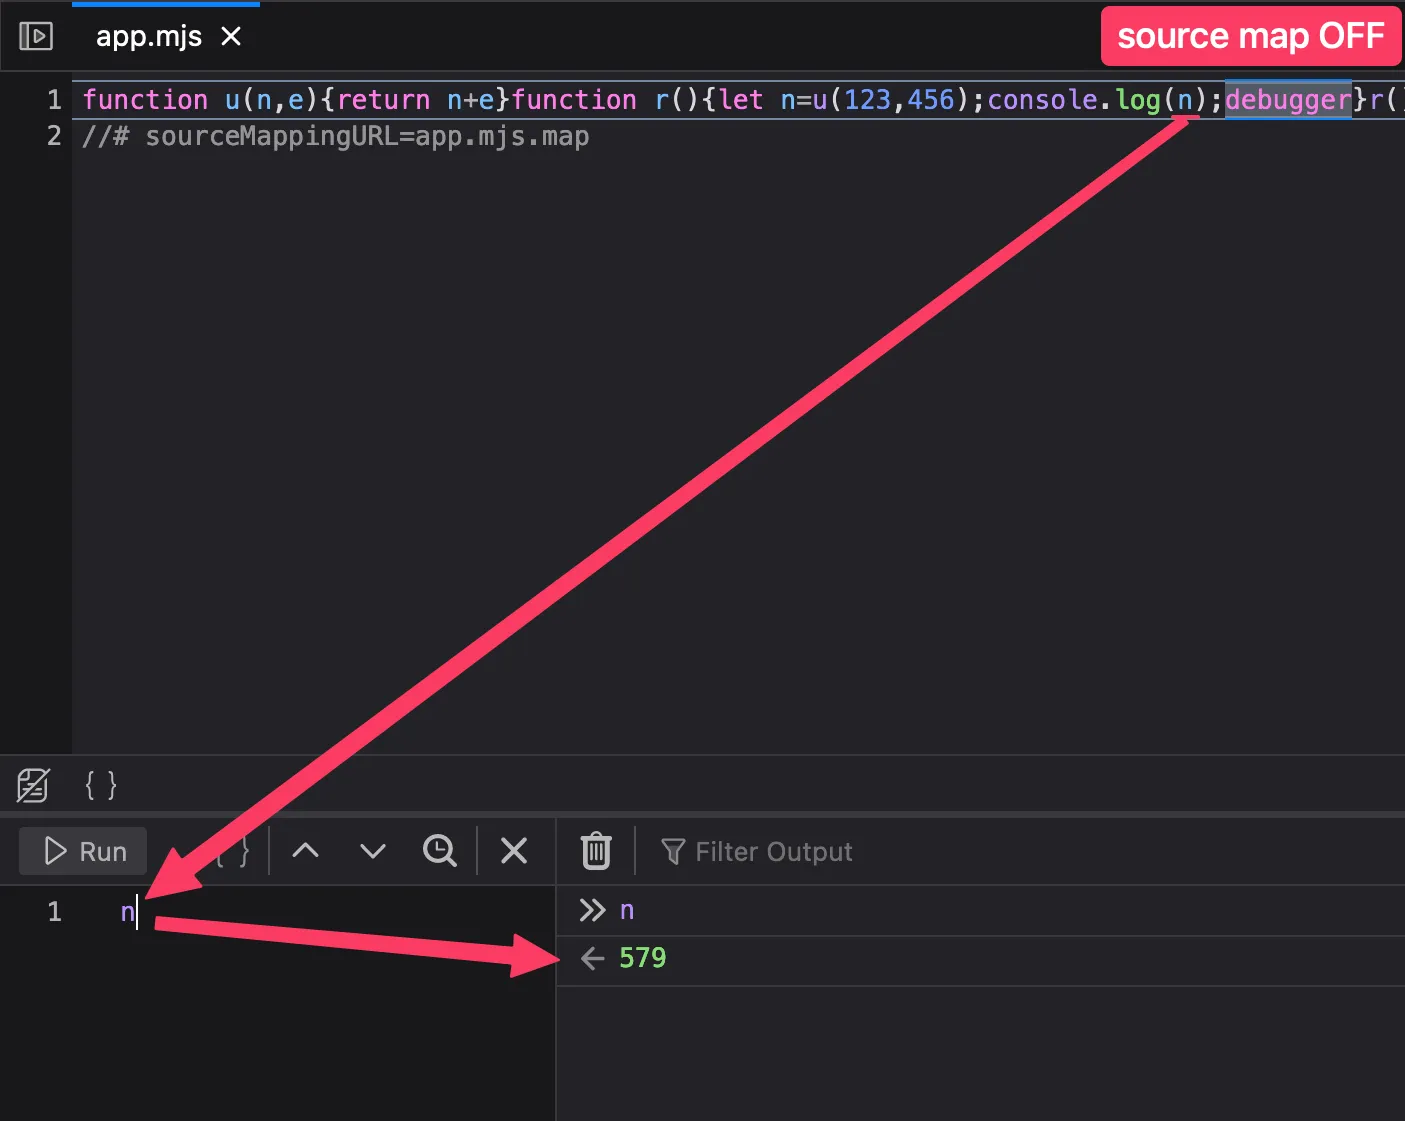 ✅ Using expressions in console works
Source Maps ON
With source maps on, we are no longer able to hover an expression and see it’s value. Adding the expression to the “Watch expressions” pane also doesn’t work:
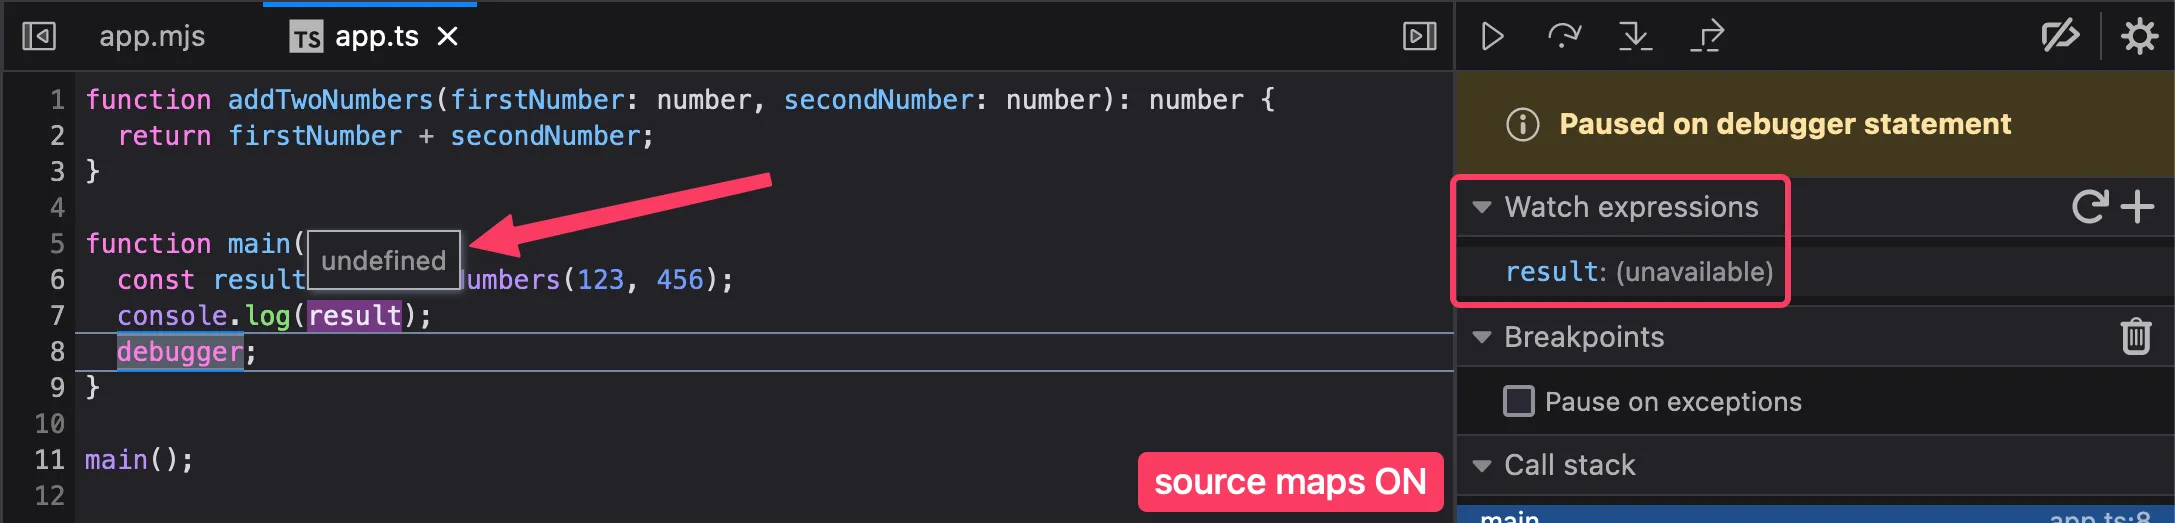 ❌ Tooltips are broken ❌ Watch expressions are broken
With source maps on, we are no longer able to use the
expression result (as seen in the source) in
the JS console:
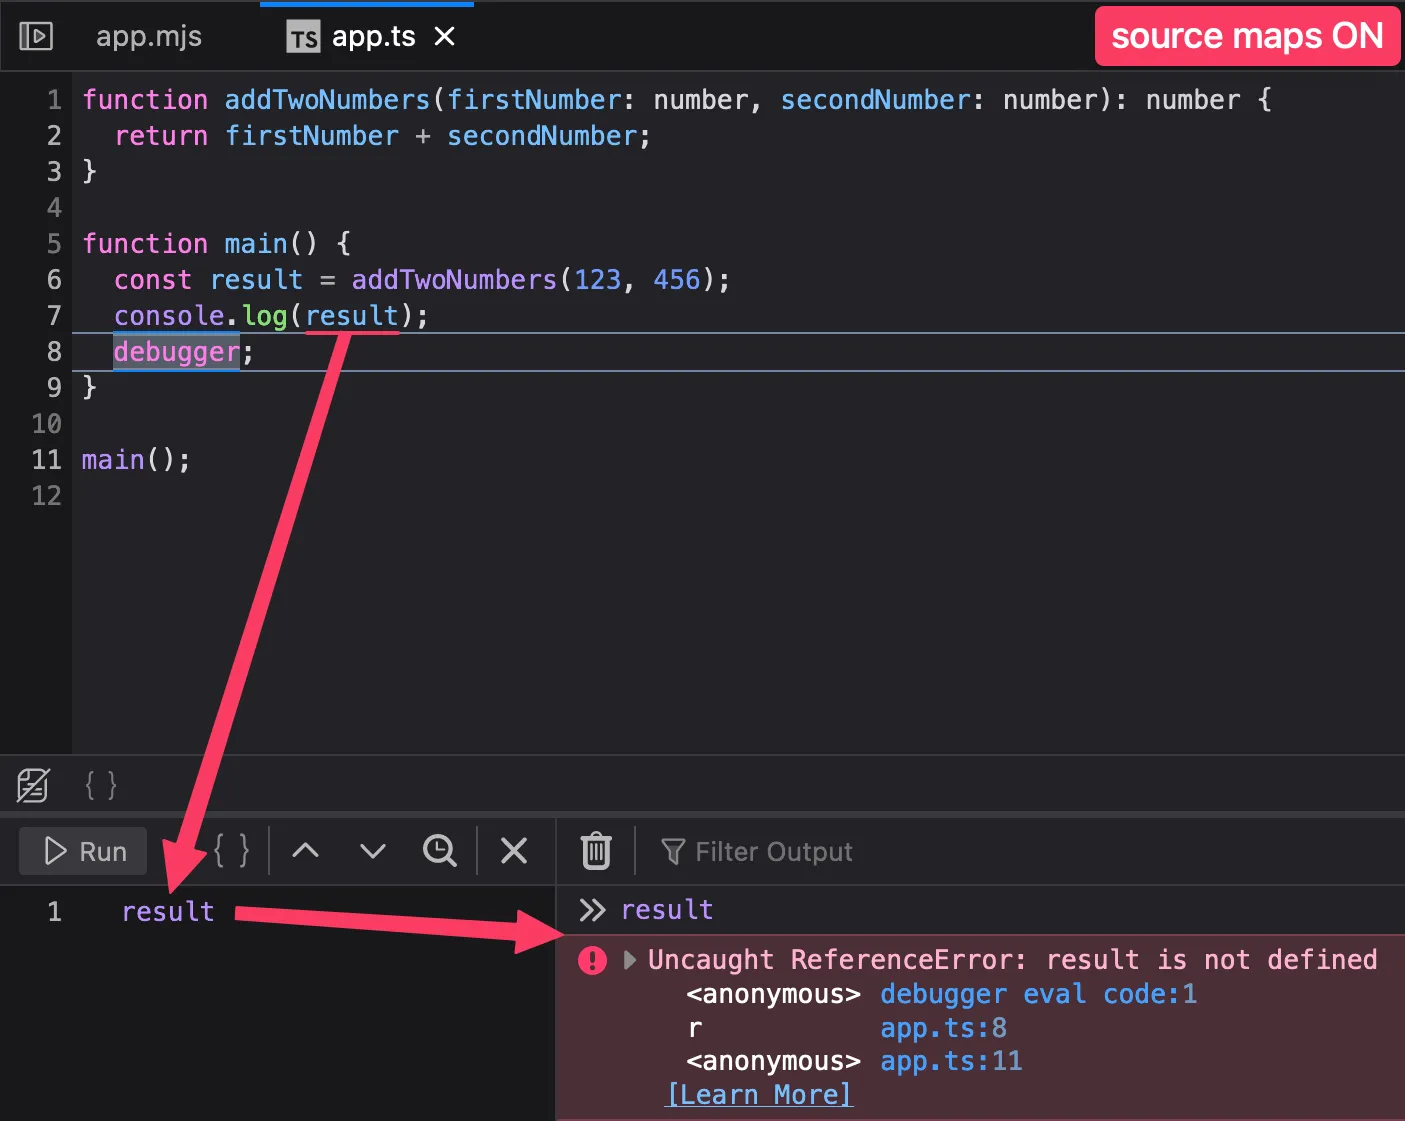 ❌ Using expressions in console is broken
How to Disable Them
Chrome

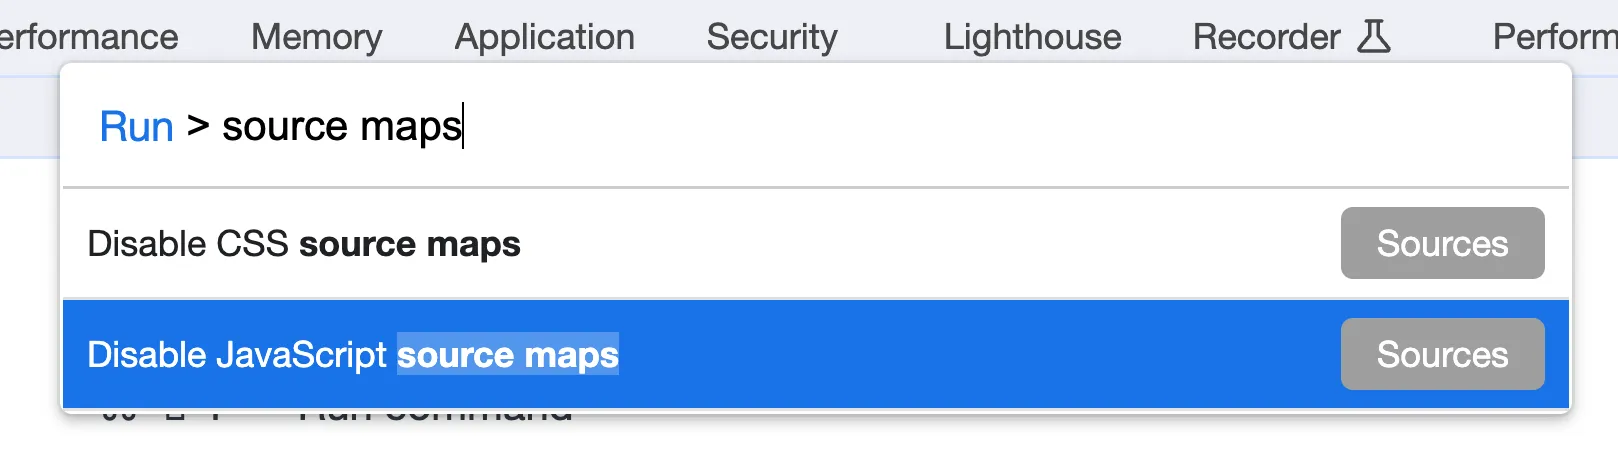
The easiest and fastest way to toggle CSS or JS source maps in the Chrome developer tools is to use Chrome’s command palette:
- On macOS type cmd+shift+p (on Windows type ctrl+shift+p)
- Search for “source map”
-
Select enable/disable for CSS or JS source maps, whichever
you want to toggle:
Firefox

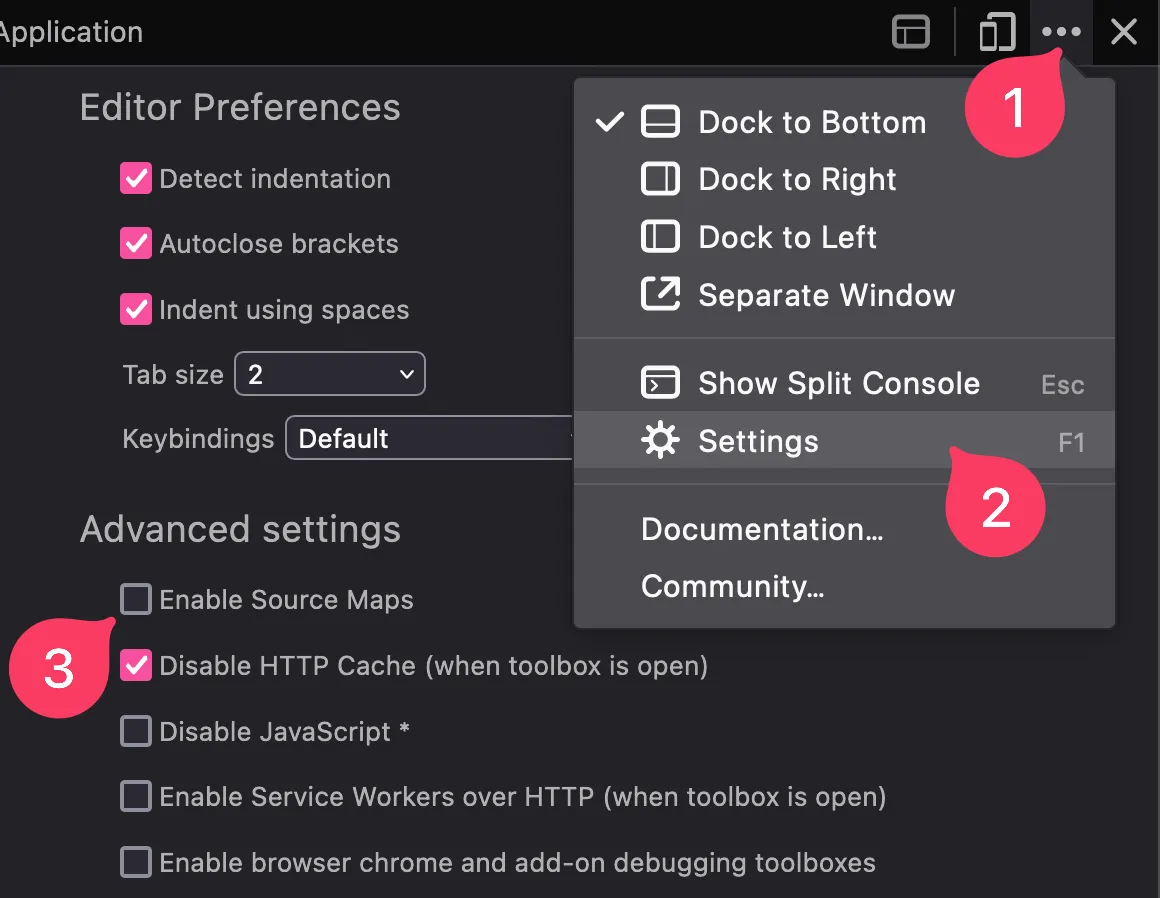
There is no similar shortcut for Firefox1 but you can toggle source maps on/off from the developer tools settings. Note that you might need to refresh the page for the change to take effect. I believe this toggles both JS and CSS source maps (e-mail me if you know for sure):
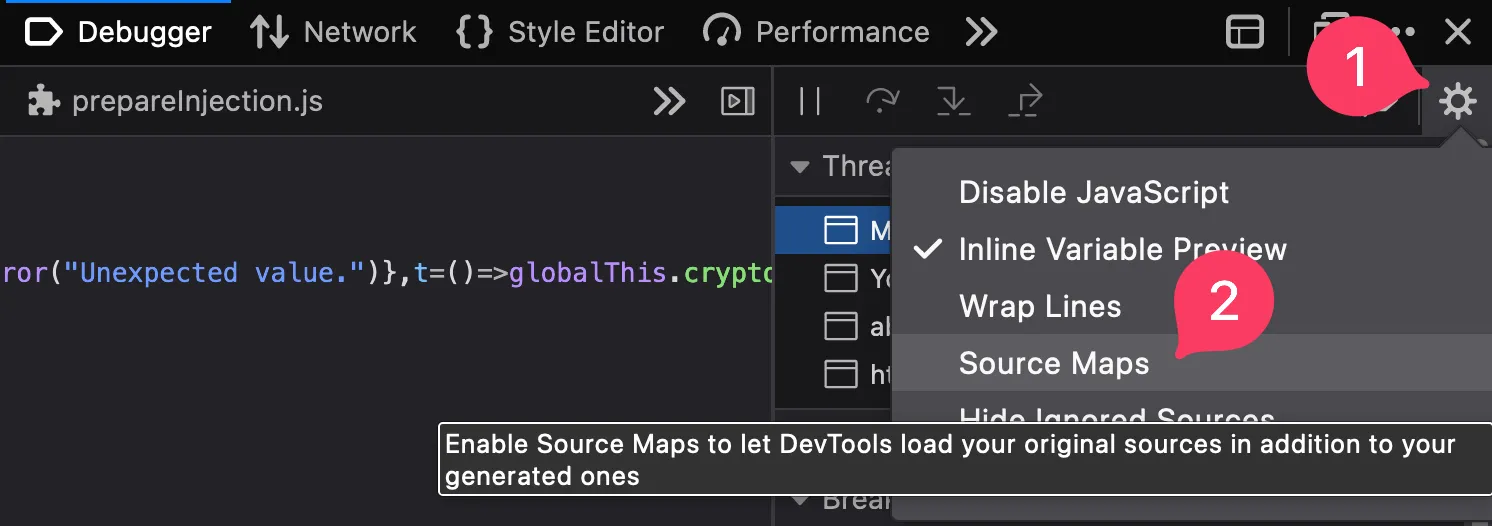
As an alternative, you can disable source maps right from the debugger without going into the settings:
Why is This a Thing?
I’m pretty sure
source maps should not be enabled by default in developer
tool debuggers. Browsers break many critical features of their debuggers, by
default, as soon as source maps are available, and break them in
a way that is totally not obvious to the developer (since
rendering undefined in a tooltip might just make it
seem like the value really is undefined).
As for improving how source maps affect the experience of debugging: there is a source map RFC at TC-39 to improve “post-hoc debuggability” with Source Maps v4.
Footnotes
-
It’s been requested: https://github.com/firefox-devtools/ux/issues/101 ↩