A list of useful, not-obvious hacks to get the most out of your browser’s1 debugger. Assumes an intermediate-level-or-higher understanding of the developer tools.
Advanced Conditional Breakpoints
By using expressions that have side effects in places you wouldn’t expect, we can squeeze more functionality out of basic features like conditional breakpoints.
Logpoints / Tracepoints
For example, we can console.log in breakpoints.
Logpoints are breakpoints that log to the console without
pausing execution. While Microsoft Edge has had logpoints
built-in for a while and Chrome just added them in v73,
Firefox does not. But, we can use conditional breakpoints to
simulate them in any browser.
Use console.count instead of
console.log if you also want a running count of
how many times the line is executed.
UPDATE (May 2020): All the major browsers now directly support logpoints/tracepoints (Chrome Logpoints, Edge Tracepoints, Firefox Logpoints)
Watch Pane
You can also use console.log in the watch pane.
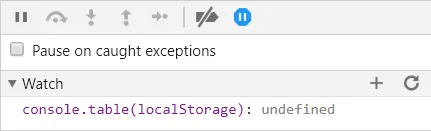
For example, to dump a snapshot of
localStorage everytime your application pauses
in the debugger, you can create a
console.table(localStorage) watch:
Or to execute an expression after DOM mutation, set a DOM
mutation breakpoint (in the Element Inspector):
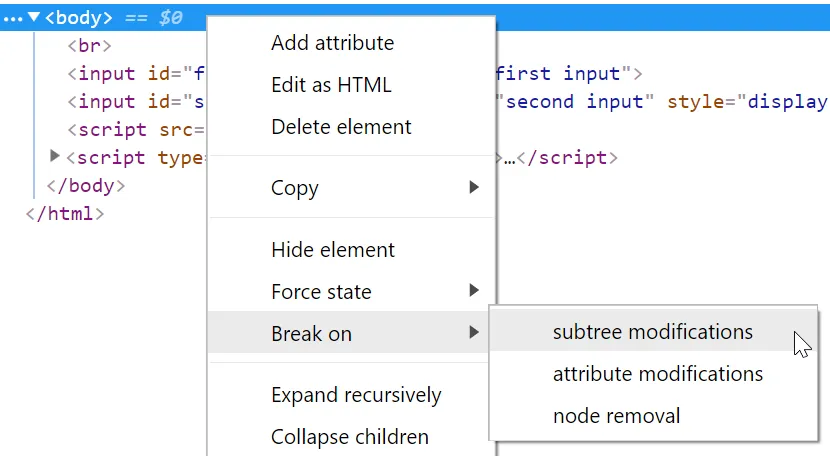
And then add your watch expression, e.g. to record a
snapshot of the DOM:
(window.doms = window.doms ||
                      []).push(document.documentElement.outerHTML)
. Now, after any DOM subtree modification, the debugger
will pause execution and the new DOM snapshot will be at the
end of the window.doms array. (There is no way
to create a DOM mutation breakpoint that doesn’t pause
execution.)
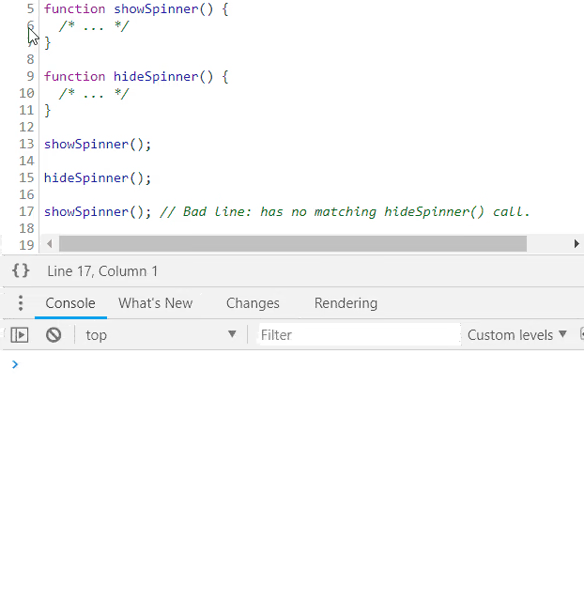
Tracing Callstacks
Let’s say you have a function that shows a loading spinner
and a function that hides it, but somewhere in your code
you’re calling the show method without a matching hide call.
How can you find the source of the unpaired show call? Use
console.trace in a conditional breakpoint in
the show method, run your code, find the last stack trace
for the show method and click the caller to go to the code:
Changing Program Behavior
By using expressions that have side effects on program behavior, we can change program behavior on the fly, right in the browser.
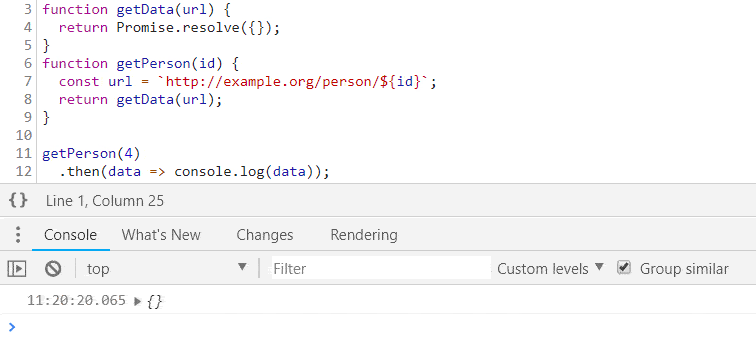
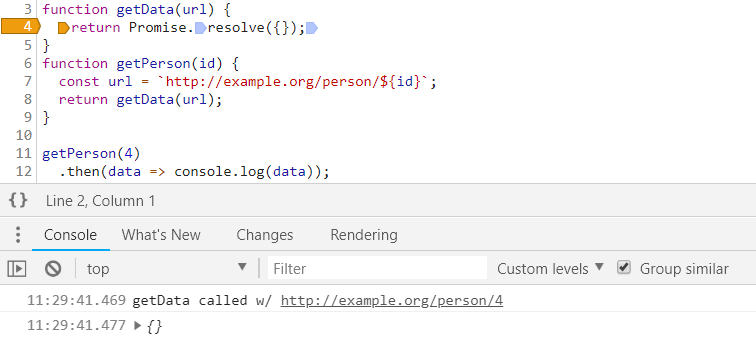
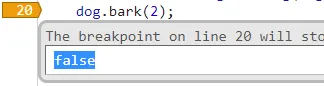
For example, you can override the param to the
getPerson function, id. Since
id=1 evaluates to true, this conditional
breakpoint would pause the debugger. To prevent that, append
, false to the expression.
Quick and Dirty Performance Profiling
You shouldn’t muddy your performance profiling with things
like conditional breakpoint evaluation time, but if you want a
quick and dirty measurement of how long something takes to
run, you can use the console timing API in conditional
breakpoints. In your starting point set a breakpoint with the
condition console.time('label') and at
the end point set a breakpoint with the condition
console.timeEnd('label'). Everytime the
thing you’re measuring runs, the browser will log to the
console how long it takes.
Using Function Arity
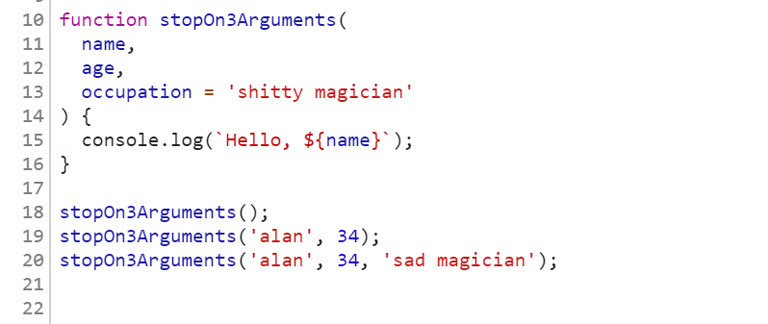
Break on Number of Arguments
Only pause when the current function is called with 3
arguments: arguments.callee.length === 3
Useful when you have an overloaded function that has optional parameters.
Break on Function Arity Mismatch
Only pause when the current function is called with the
wrong number of arguments:
(arguments.callee.length) != arguments.length
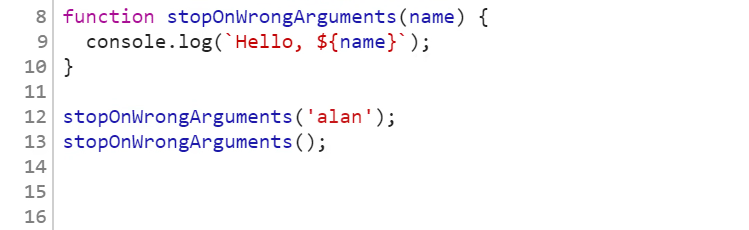
Useful when finding bugs in function call sites.
Using Time
Skip Page Load
Don’t pause until 5 seconds after page load:
performance.now() > 5000
Useful when you want to set a breakpoint but you’re only interested in pausing execution after initial page load.
Skip N Seconds
Don’t pause execution if the breakpoint is hit in the next 5
seconds, but pause anytime after:
window.baseline = window.baseline || Date.now(),
                      (Date.now() - window.baseline) > 5000
Reset the counter from the console anytime you’d like:
window.baseline = Date.now()
Using CSS
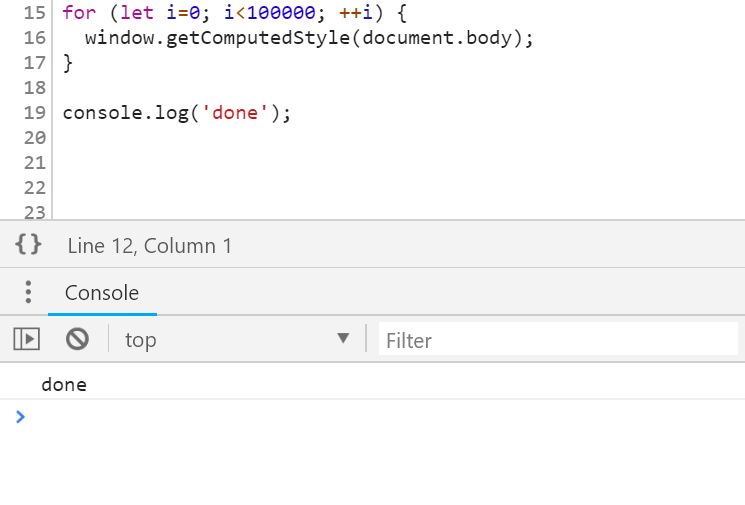
Pause based on computed CSS values, e.g. only pause execution
when the document body has a red background color:
window.getComputedStyle(document.body).backgroundColor ===
                    "rgb(255,0,0)"
Even Calls Only
Only pause every other time the line is executed:
window.counter = (window.counter || 0) + 1, window.counter
                    % 2 === 0
Break on Sample
Only break on a random sample of executions of the line, e.g.
only break 1 out of every 10 times the line is executed:
Math.random() < 0.1
Never Pause Here
When you right-click the gutter and select “Never Pause Here,”
Chrome creates a conditional breakpoint that is
false and never passes. This makes it so that the
debugger will never pause on this line.
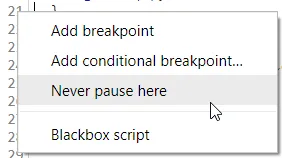
Useful when you want to exempt a line from XHR breakpoints, ignore an exception that is being thrown, etc.
Automatic Instance IDs
Automatically assign a unique ID to every instance of a class
by setting this conditional breakpoint in the constructor:
(window.instances = window.instances ||
                    []).push(this)
Then to retrieve the unique ID:
window.instances.indexOf(instance) (e.g.
window.instances.indexOf(this) when in a class
method)
Programmatically Toggle
Use a global boolean to gate one or more conditional breakpoints:
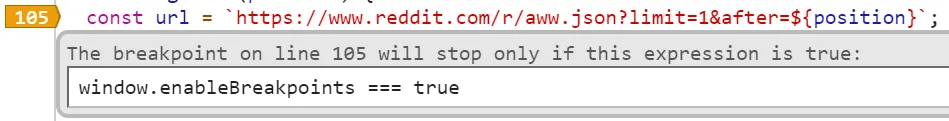
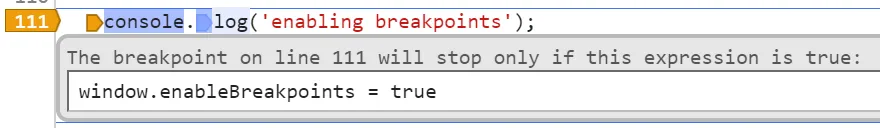
Then programmatically toggle the boolean, e.g.
-
manually, from the console
window.enableBreakpoints = true;
-
from other breakpoints
-
from a timer on the console
setTimeout(() => (window.enableBreakpoints = true), 5000);
- etc
monitor() class Calls
You can use Chrome’s monitor command line method to
easily trace all calls to class methods. E.g. given a class
Dog
class Dog { bark(count) { /* ... */ }}
If we want to know all calls made to all instances of
Dog, paste this into the command line:
var p = Dog.prototype;Object.getOwnPropertyNames(p).forEach((k) => monitor(p[k]));and you’ll get output in the console:
> function bark called with arguments: 2
You can use debug instead of
monitor if you want to pause execution on any
method calls (instead of just logging to the console).
From a Specific Instance
If you don’t know the class but you have an instance:
var p = instance.constructor.prototype;Object.getOwnPropertyNames(p).forEach((k) => monitor(p[k]));
Useful when you’d like to write a function that does this for
any instance of any class (instead of just Dog)
Call and Debug a Function
Before calling the function you want to debug in the console,
call debugger. E.g. given:
function fn() { /* ... */}From your console:
> debugger; fn(1);
And then “Step into next function call” to debug the
implementation of fn.
Useful when you don’t feel like finding the definition of
fn and adding a breakpoint manually or if
fn is dynamically bound to a function and you don’t
know where the source is.
In Chrome you can also optionally call debug(fn) on
the command line and the debugger will pause execution inside
fn every time it is called.
Pause Execution on URL Change
To pause execution before a single-page application modifies the URL (i.e. some routing event happens):
const dbg = () => { debugger;};history.pushState = dbg;history.replaceState = dbg;window.onhashchange = dbg;window.onpopstate = dbg;
Creating a version of dbg that pauses execution
without breaking navigation is an exercise left up to the
reader.
Also, note that this doesn’t handle when code calls
window.location.replace/assign directly because the
page will immediately unload after the assignment, so there is
nothing to debug. If you still want to see the source of these
redirects (and debug your state at the time of redirect), in
Chrome you can debug the relevant methods:
debug(window.location.replace);debug(window.location.assign);Debugging Property Reads
If you have an object and want to know whenever a property is
read on it, use an object getter with a
debugger call. For example, convert
{configOption: true} to
{get configOption() { debugger; return true; }}
(either in the original source code or using a conditional
breakpoint).
Useful when you’re passing in some configuration options to something and you’d like to see how they get used.
Use copy()
You can copy interesting information out of the browser directly
to your clipboard without any string truncation using the
copy() console API. Some interesting things you
might want to copy:
-
Snapshot of the current DOM:
copy(document.documentElement.outerHTML) -
Metadata about resources (e.g. images):
copy(performance.getEntriesByType("resource")) -
A large JSON blob, formatted:
copy(JSON.parse(blob)) -
A dump of your localStorage:
copy(localStorage) - Etc.
Debugging HTML/CSS
The JS console can be helpful when diagnosing problems with your HTML/CSS.
Inspect the DOM with JS Disabled
When in the DOM inspector press ctrl+\ (Chrome/Windows) to pause JS execution at any time. This allows you to inspect a snapshot of the DOM without worrying about JS mutating the DOM or events (e.g. mouseover) causing the DOM to change from underneath you.
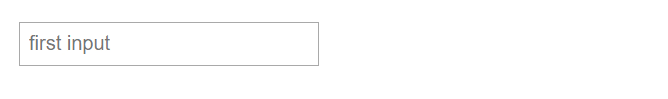
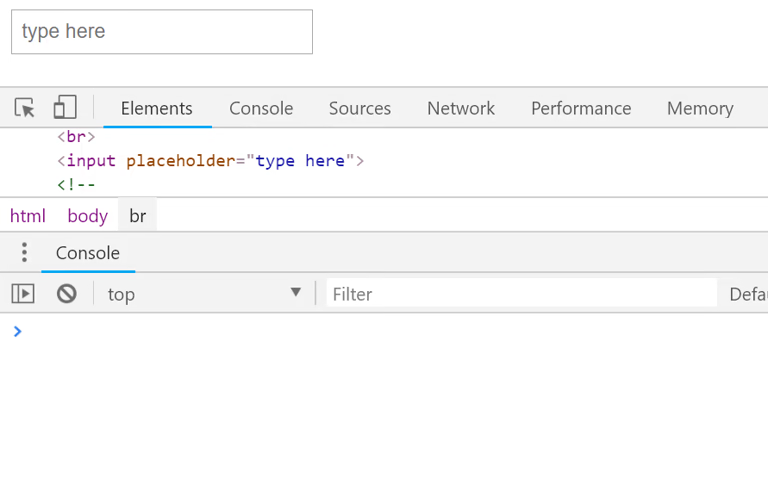
Inspect an Elusive Element
Let’s say you want to inspect a DOM element that only conditionally appears. Inspecting said element requires moving your mouse to it, but when you try to, it disappears:
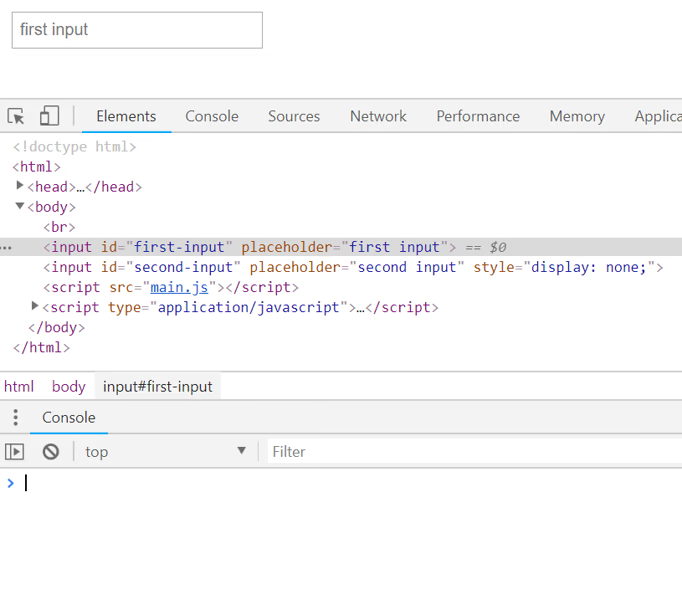
To inspect the element you can paste this into your console:
setTimeout(function() { debugger; }, 5000);. This
gives you 5 seconds to trigger the UI, and then once the 5
second timer is up, JS execution will pause and nothing will
make your element disappear. You are free to move your mouse
to the dev tools without losing the element:
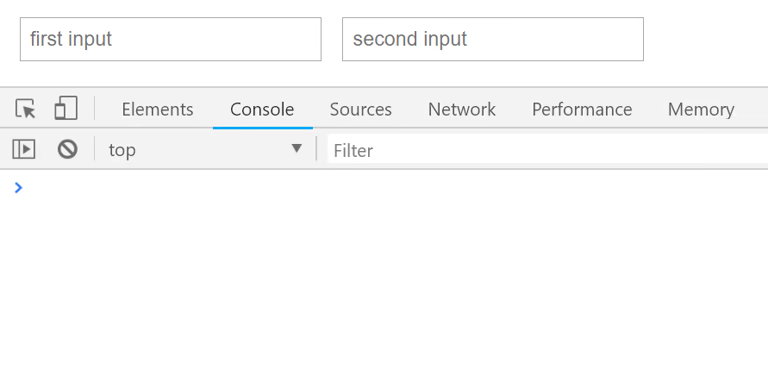
While JS execution is paused you can inspect the element, edit its CSS, execute commands in the JS console, etc.
Useful when inspecting DOM that is dependent on specific cursor position, focus, etc.
Record Snapshots of the DOM
To grab a copy of the DOM in its current state:
copy(document.documentElement.outerHTML);To record a snapshot of the DOM every second:
doms = [];setInterval(() => { const domStr = document.documentElement.outerHTML; doms.push(domStr);}, 1000);Or just dump it to the console:
setInterval(() => { const domStr = document.documentElement.outerHTML; console.log("snapshotting DOM: ", domStr);}, 1000);Monitor Focused Element
(function () { let last = document.activeElement; setInterval(() => { if (document.activeElement !== last) { last = document.activeElement; console.log("Focus changed to: ", last); } }, 100);})();
Find Bold Elements
const isBold = (e) => { let w = window.getComputedStyle(e).fontWeight; return w === "bold" || w === "700";};Array.from(document.querySelectorAll("*")).filter(isBold);Just Descendants
Or just descendants of the element currently selected in the inspector:
Array.from($0.querySelectorAll("*")).filter(isBold);Reference Currently Selected Element
$0 in the console is an automatic reference to
the currently selected element in the element inspector.
Previous Elements
In Chrome and Edge you can access the element you last
inspected with $1, the element before that with
$2, etc.
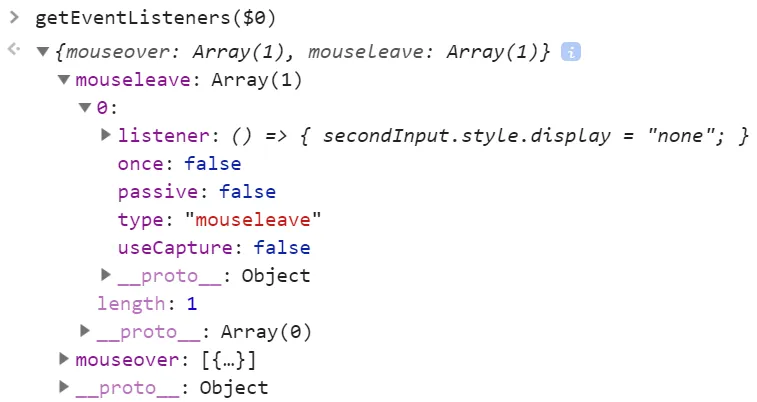
Get Event Listeners
In Chrome you can inspect the event listeners of the
currently selected element:
getEventListeners($0), e.g.
Monitor Events for Element
Debug all events for selected element:
monitorEvents($0)
Debug specific events for selected element:
monitorEvents($0, ["control",
                    "key"])
Footnotes
-
Tips are supported in Chrome, Firefox, and Edge unless the browser logos say otherwise:


 ↩
↩